Anomaly Detection
The Anomaly Detection project aims to create an interactive dashboard using a month's worth of interaction logs from DocDigitizer's cognitive data extraction service.
The objective is to define normal interaction patterns and identify entries that deviate from these patterns. The model should extend its functionality to handle live data streams, detecting outliers, and generating alerts for instances of predicted heavy load.

Observation & Findings:
Data Conversion: The initial data preprocessing involves converting object data types to relevant data formats suitable for analysis. Columns like 'Time Stamp,' 'Timestamp Request,' and 'Timestamp Response' are converted to datetime objects.
Data Cleaning: Handling missing values involved dropping rows with null values in specific columns such as 'Timestamp Request' and 'Timestamp Response.' Other columns like 'Source IP,' 'HTTP Auth,' 'HTTP Auth Hash,' 'Resource,' 'Organization,' 'App,' 'User,' and 'Entity' had significant missing values which were filled with appropriate placeholders or default values.
Feature Engineering: A new column 'Response Time' was created by calculating the time taken for a request to receive a response. Additionally, columns like 'Resource Class' and 'Resource Method' were dropped due to having identical values to the 'Resource' column.
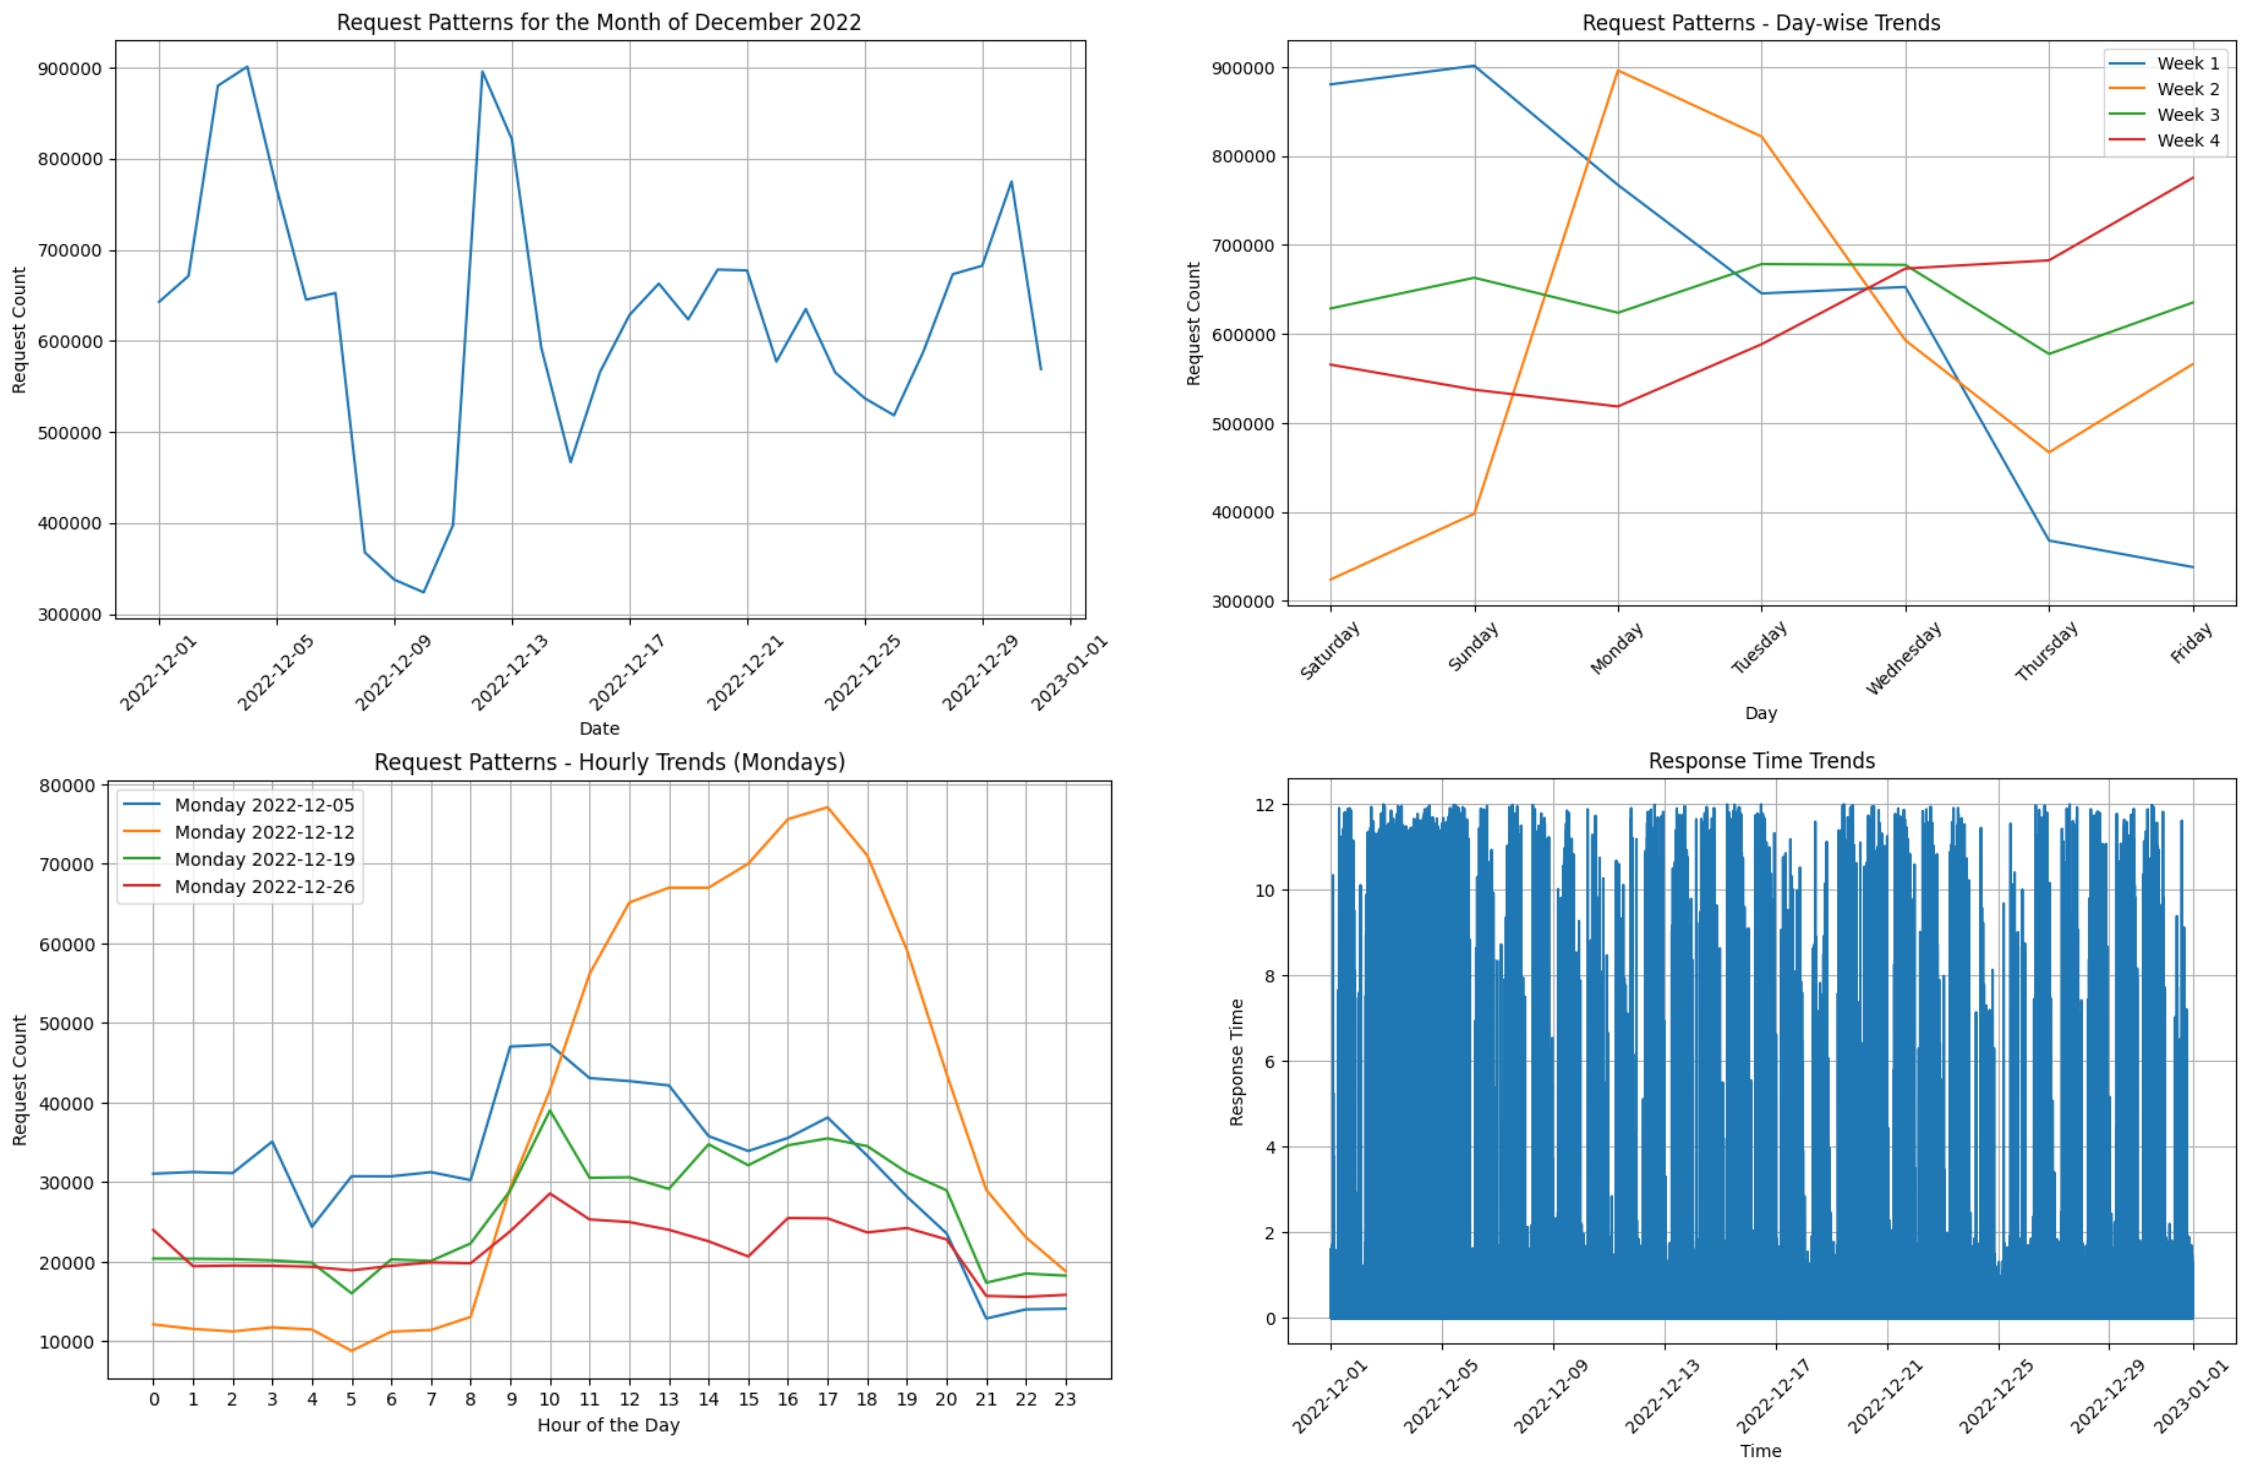
Exploratory Data Analysis (EDA): Initial analysis includes visualizing the count of records on a daily basis, revealing a significant drop in requests between December 8th and 11th. A box plot visualized the distribution of response times, indicating outliers beyond 12 seconds.
Company ID Mapping: The unique Organization IDs were mapped to convenience names ('Company 1', 'Company 2', etc.) for ease of analysis and interpretation.
Response Time Trends: A line plot was generated to illustrate the trends in response times over time, aiming to detect any patterns or anomalies in the data.